Warren Buffett’s timeless investment wisdom emphasizes the importance of contrarian thinking: embracing opportunities when others are fearful and exercising caution when optimism reigns supreme. In the volatile world of stock markets, identifying fear or greed can be challenging. Technical analysis provides tools to gauge market sentiment, and one such indicator is the Relative Strength Index (RSI). RSI measures the momentum of price changes on a scale of 0 to 100, with readings below 30 typically indicating an “oversold” condition. This suggests that the selling pressure might be nearing exhaustion, potentially presenting a buying opportunity for astute investors. While not a foolproof predictor, RSI offers valuable insights into potential market turning points.
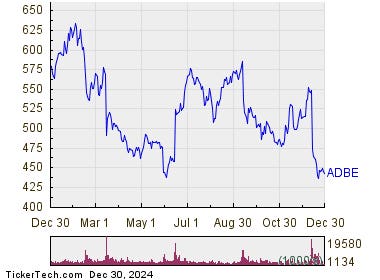
Adobe (ADBE), a prominent software company, recently entered oversold territory, registering an RSI of 29.4 after its stock price dipped to $438.57. This contrasted with the S&P 500 ETF (SPY)’s RSI of 40.9, indicating that ADBE experienced more significant selling pressure relative to the broader market. For bullish investors, this low RSI reading could signal a potential bottoming out of the recent downturn. It suggests that the intensity of selling might be waning, paving the way for a potential price rebound. While an oversold RSI doesn’t guarantee an immediate price reversal, it can serve as a valuable alert for investors seeking entry points into a potentially undervalued stock.
A deeper dive into ADBE’s price chart reveals a 52-week range spanning from a low of $432.47 to a high of $638.25, with the recent dip placing it near the lower end of this range. The proximity to the 52-week low, coupled with the oversold RSI, paints a picture of a potentially attractive entry point for long-term investors. However, it’s crucial to remember that RSI is just one piece of the puzzle. A comprehensive investment analysis should also consider fundamental factors, such as the company’s financial health, growth prospects, and competitive landscape, before making any investment decisions.
The concept of oversold stocks, as identified by indicators like RSI, hinges on the notion of mean reversion. This principle suggests that stock prices tend to fluctuate around a long-term average, and extreme deviations, whether positive or negative, are often followed by a return towards this average. An oversold condition implies that the price has moved significantly below its recent average, increasing the likelihood of a subsequent upward correction. However, it’s essential to acknowledge that market dynamics can be complex and influenced by a multitude of factors. An oversold reading doesn’t automatically guarantee a price reversal, and other market forces could prolong the downward trend.
The identification of oversold stocks offers a starting point for further research and analysis. Investors shouldn’t rely solely on technical indicators like RSI but should delve deeper into the underlying reasons for the price decline. Is it a reflection of company-specific issues, industry headwinds, or broader macroeconomic concerns? Understanding the context behind the price movement is crucial for assessing the true investment potential. Furthermore, considering other technical indicators, fundamental analysis, and market sentiment can provide a more holistic view and enhance the decision-making process.
In conclusion, while an oversold RSI can be a valuable signal, it’s essential to approach it with caution and conduct thorough due diligence. It’s not a standalone predictor of future price movements but rather a tool that can aid in identifying potential opportunities. Combining RSI analysis with other technical and fundamental factors provides a more robust framework for making informed investment decisions. Remember, successful investing involves not only identifying potential bargains but also understanding the underlying dynamics driving market movements and exercising sound judgment.

